Before understanding forex basic strategy we should know, what is a strategy? Strategy is a process to achieve a certain goal, it involves planning, organizing, coordinating, managing & controlling. When we talk about forex strategy we generally talk about trading strategy, how do you develop a trading strategy that can provide you more of winning trades than losing ones.
Forex Strategy or trading strategy consists of everything starting from trading plan, technical analysis, fundamental analysis, sentiment analysis and emotion control etc., Our main emphasis will be on understanding technical analysis and all the other aspects which should be considered in developing a good trading strategy.
Fundamental analysis is used to know the fair value of a currency pair because it is believed that in a long term market the fair value of currency is very important. Fundamental analysis is achieved keeping in mind the economic outlook, GDP rate, interest rate, balance of payment, the political climate of different countries etc.
Sentimental analysis is basically an opinion of individual of what they think about the market, if more people think that they should buy a certain pair of currency then that particular currency pair would rise in value, the best way to know about sentimental analysis is to know how hedge fund managers, banks, financial institutions, Central Bank chiefs think?
Prices move with Trends
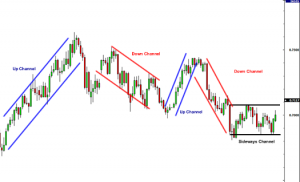
Prices move in three directions, up, down or sideways.
A trend is defined as a term when prices persistently move in one direction either up or down. When prices move in sideways then there is no trend.
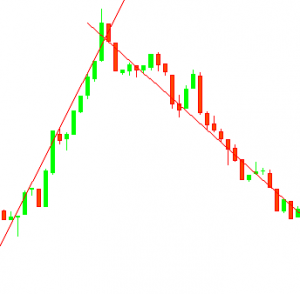
In the above image first there was an up trend when prices continuously move upward, green candlesticks show the upward price movement however after some time prices took a reverse course of action when there was a continuous down trend shown with red candlestick, both types of trends are good for a trader, in either case you make money if your prediction goes with the market price movement.
How to draw trend lines?
It requires at least two tops or bottoms to draw a trend line.
More steeper the trend line, less reliable it would be and more chances are that it would break.
Trend lines become stronger, the more they are tested.
Uptrend line is drawn by identifying support areas (valleys) from the bottom to the top.
Downtrend line is drawn by identifying resistance areas (peaks) from top to bottom.
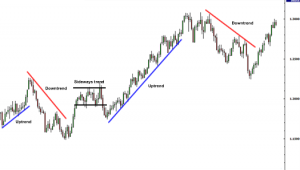
Ascending channel can be created by drawing a parallel line to the same angle of uptrend line and then move the line to the position where it touches a recent peak.
Descending channel can be created by drawing a parallel line to the same angle of downtrend line and then move the line to the position where it touches recent support
Horizontal channel is also called range bound when price moves in the channel range. Bottom of the channel is considered as buying area while the top of the channel is considered as sell area. Buy when price hits bottom trend line and sell when price hits the top trend line.
The Meta Trader 4 Platform allows users to create channels using Equidistant Channels. Simply click on Equidistant Channel button and draw the line.
How to Instal Moving Average?
At the top of the toolbar in Meta 4 select Insert, Indicators, Moving Average
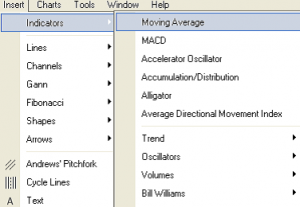
In the Moving Average window select the desired period, color and style. In this example, 10 periods are selected.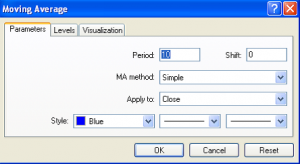
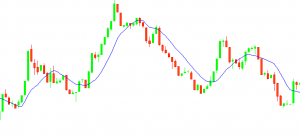
Below mentioned chart shows the 10 period moving average
How to Trade with Moving Average (Moving Average Strategy)?
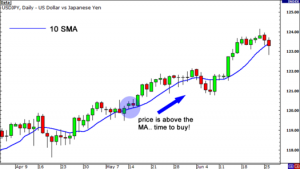
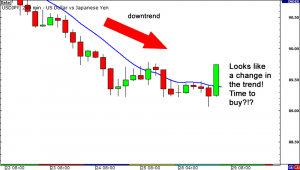
The above image shows uptrend as MA is below the price action. The image below shows that the downturn is going to reverse as price action goes above MA however it is a fake out and it is confirmed by the next image.
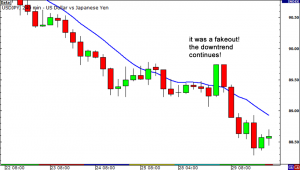
How to overcome fakeout signals?
Fakeout signals can be removed from trading by using two or 3 moving averages with different speed. In an uptrend, the faster MA would be above the slower MA and in a downtrend slower
MA would be above the faster MA.
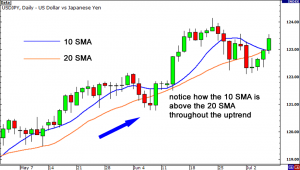
In the above chart faster moving average SMA 10 is above SAM 20 throughout the uptrend and price actions are above the MA most of the time.
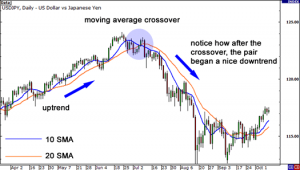
In the above image SMA 10 was above the SMA 20 during an uptrend however reversal happened when the downturn started, price action during uptrend was above the MA but it went below the MA once the downturn started.
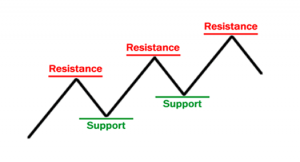
In the above chart suppose prices goes high and then pull back before going high again. The highest point the price reached before, is the resistance level and pull back point becomes the current support level. After pullback rally breaks the previous resistance level then the previous resistance level becomes the new support level, the same applies in case of a downturn.
Joining all the resistance levels (peaks) creates a top line & joining all the support levels (valleys) creates a bottom line (shown in the image below).
Support and resistance describes the price levels where the market repeatedly rises or falls and reverses. It reflects the phenomenon of basic supply and demand as well as human psychology.
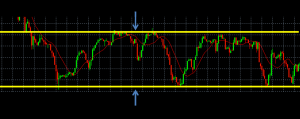
Support and Resistance Strategy – Sell at the top peaks and buy at the bottom valleys
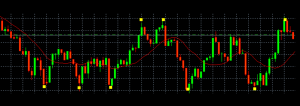
Bollinger Bounce – It works on a range bound market and works on the notion that prices always tend to be middling between Bollinger bands. You buy when prices hit lower band and sell when it hits higher band. It acts like dynamic support and resistance level. The longer the time frame the stronger the band will be.
Bollinger Squeeze – It is used to get breakout signal, if the band squeezes then the market is quiet and in low volatility and breakout is going to happen sooner. If the candle stick breaks out above the top band then the price would continue to go up. If the candle stick breaks out below the lower band then the price would continue to go down.
How to Instal Bollinger Bands in Meta trader 4?
From the toolbar select Insert, Indicators, Bollinger Bands
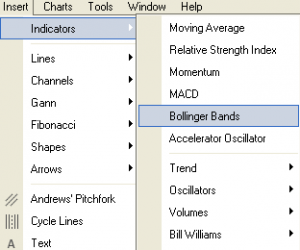
The ideal parameter for Bollinger Bands is 20 period and 2 standard deviations however it can be changed as per requirement & strategy.
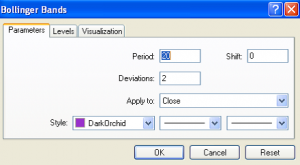
Change the parameters as required. We have chosen 20 periods and 2 standard deviation.
How to trade with Bollinger Bands (Bollinger Band Strategy)?
When the market is quiet and trades in a narrow range, the Bollinger bands would squeeze together and it shows that the market has an extremely low volatility and breakout is going to happen sooner.
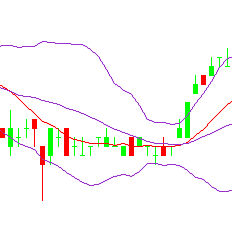
In the above image, after a narrow range of trading and low volatility prices break above the top band and rises further, breakout confirms the uptrend.
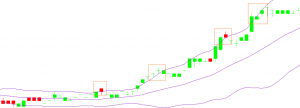
In the above image we can see a long rally of uptrend happens after the breakout. After a narrow range of trading, breakouts can happen either at the top or bottom of the band, normally these breakouts carry a very long rally & money making opportunity.
How to instal Parabolic SAR?
From top of the Metatrader 4.0 toolbar select Insert, Indicators, Trends, Parabolic SAR
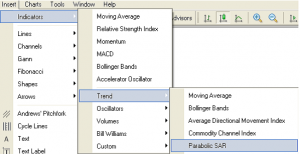
How to use the Parabolic SAR (Parabolic SAR Strategy):
We use it for bullish and bearish trend so when dots are below candlesticks then it is a buy signal, when the dots are above the candlesticks then it is a sell signal. Don’t use it when the market is choppy.
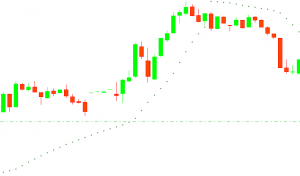
In the above image initially there was a strong uptrend and parabolic SAR dots were below the candlesticks however after the reversal of the trend dots go above the candlesticks, and confirms the downtrend.
Conclusion
We have learned what is strategy, how to develop strategy, types of forex analysis, why technical analysis is so important, what the trends are, how to create trend lines, what channels are and how to trade with channels, we also learned how to develop strategy and trade with various indicators like Moving Average, Bollinger Band, Stop and Reversal & parabolic SAR etc.. Finally, I would like to say using basic strategy with technical analysis is good to make money in the forex market however you should always keep an eye on fundamental aspect of trading and market volatility caused due to news events.


